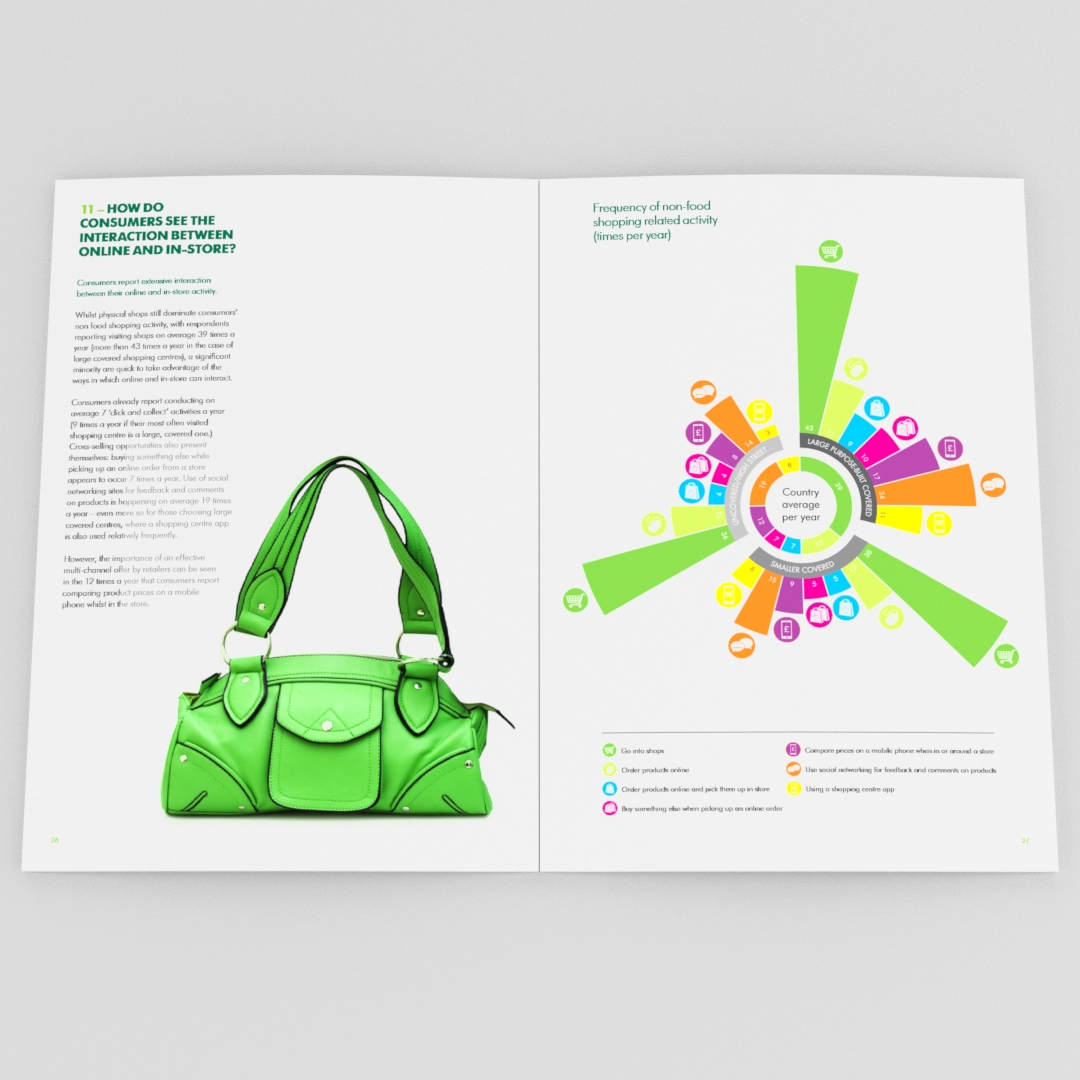
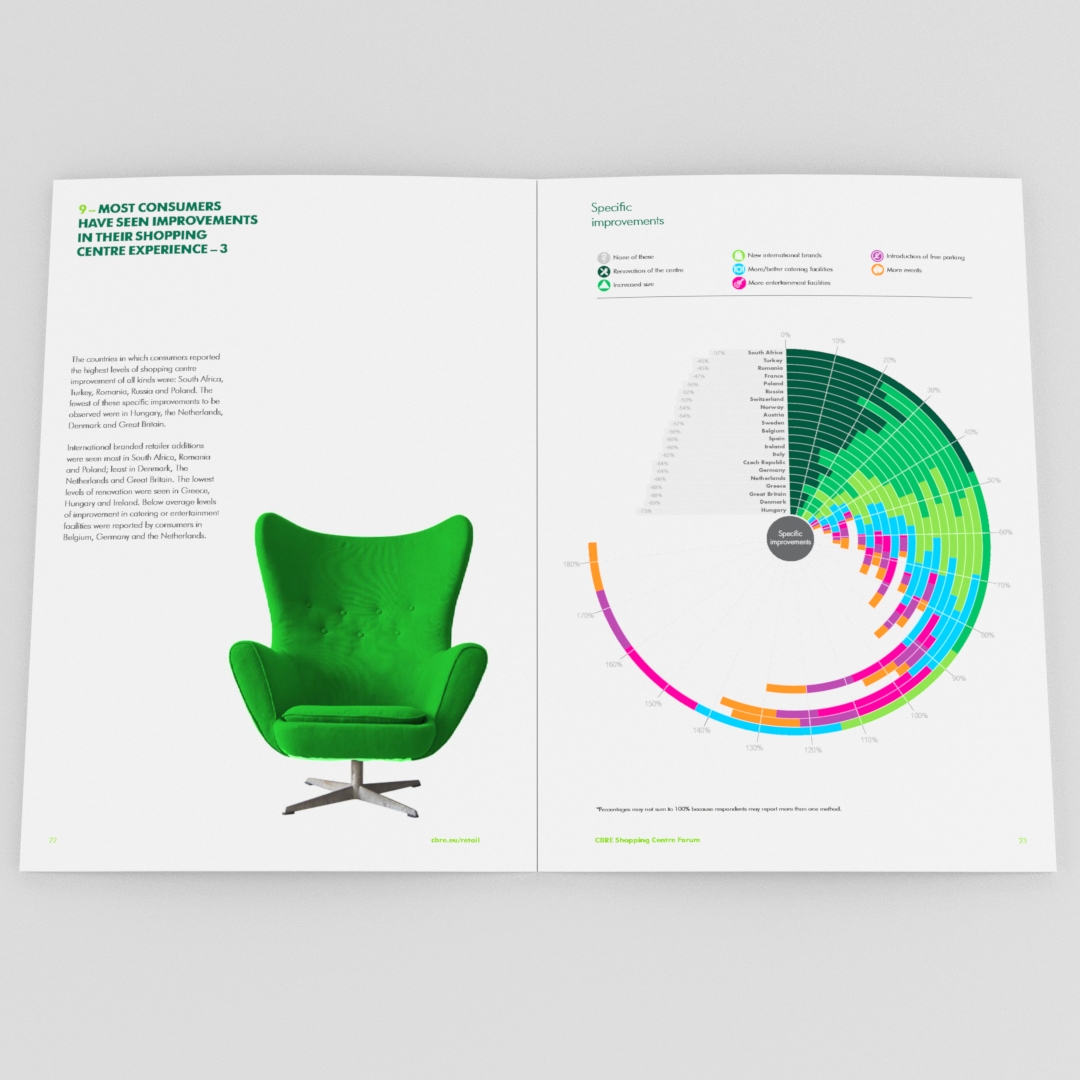
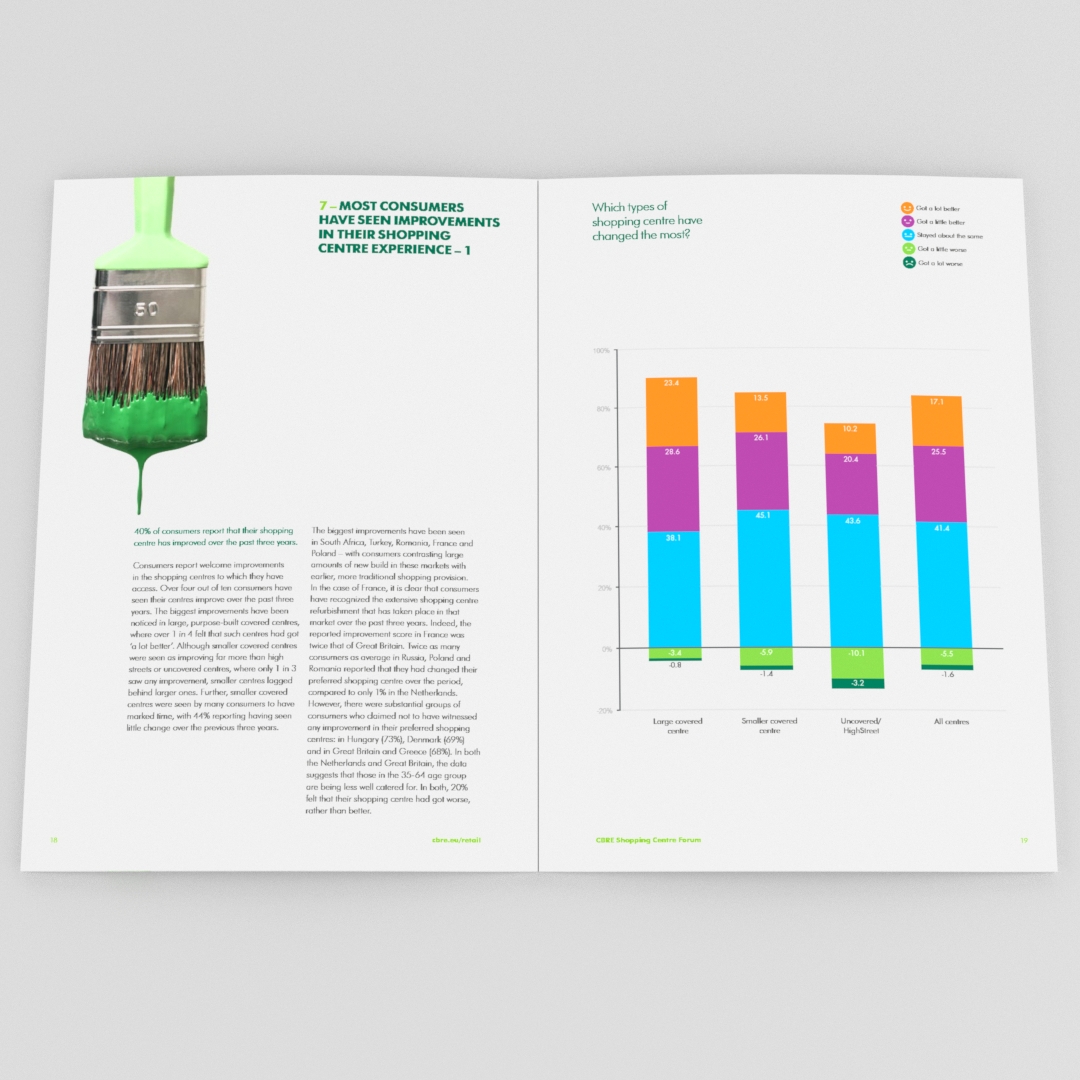
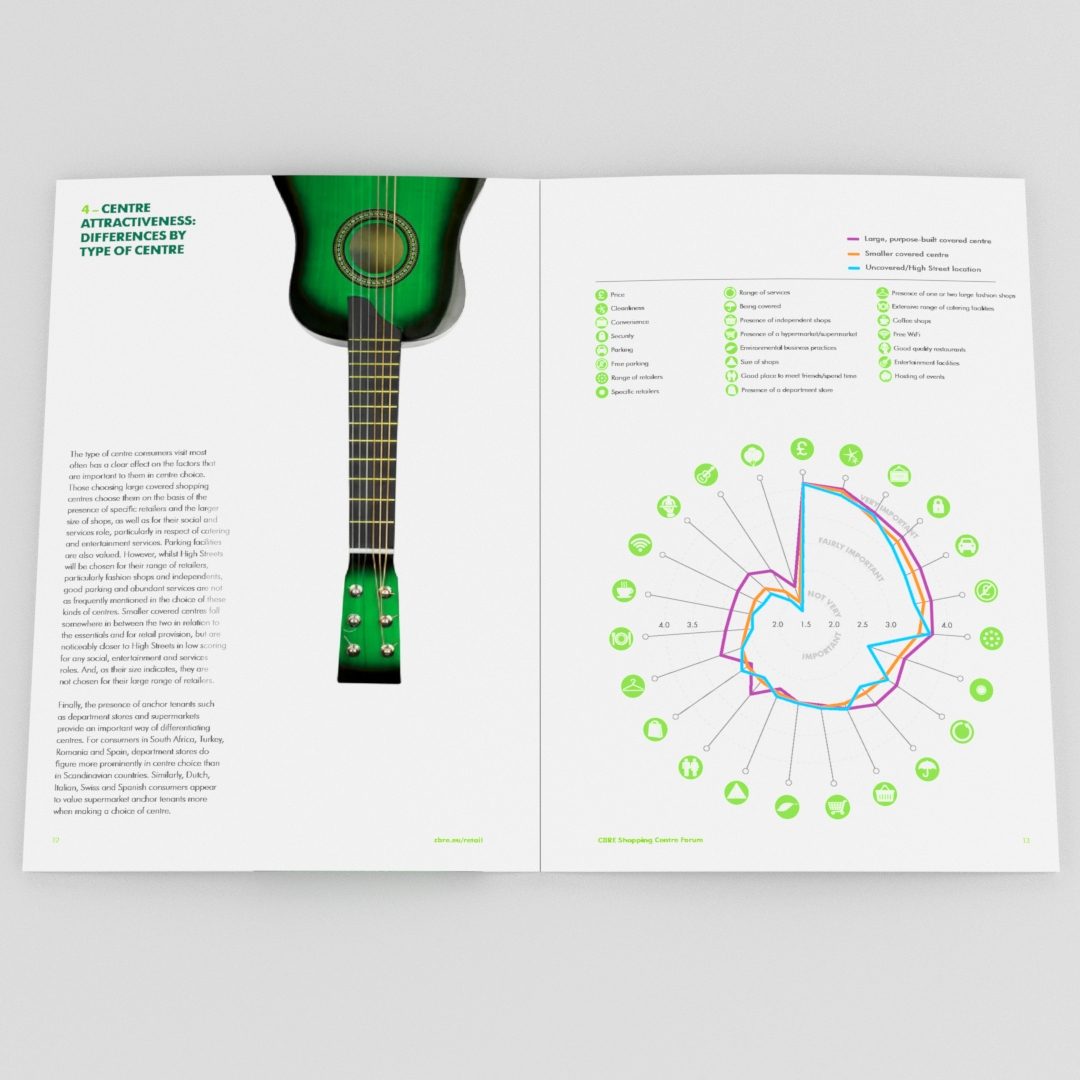
I was tasked to create infographics using raw Excel sheets. After discussions with the project team at CBRE I realise that they actually want something ‘more than just a chart’. i.e. Fancy charts.
HB
CBRE
Illustrator, InDesign, Photoshop
A4